|
Script:
RTT ATR Envelopes
 Back to Catalogue Back to Catalogue
Purpose:
Draw two bands around an EMA of “typical” daily prices.
The Central line is calculated from the day’s Pivot Points, of which an Exponential Moving Average is calculated. Outer and Inner bands are then drawn at a distance of selected multiples of Average True Range (ATR) above and below the Pivot EMA.
The recent Lows and Highs of each band are indicated at the right-hand side of the chart towards the price scale.
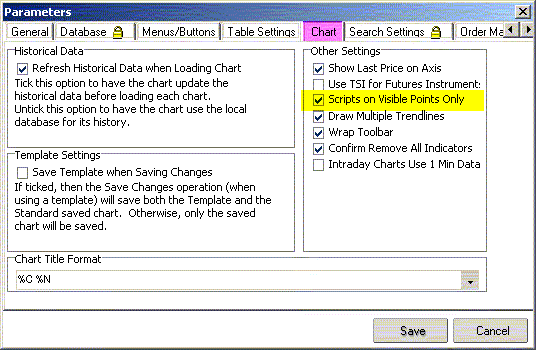
To save time, it is recommended to set the global chart parameters to "calculate visible points only". This means the script calculates and draws only for the days visible in the current window. (see "Parameters" below)
If you zoom out and wish to expand the plot, right-click inside the window, select the script's Properties, and click "OK". That will redraw the plot for the larger time frame.
Please note that plotted scripts work on any time scale. When using different scales, replace "day" by "tick" (month, week, hour, ...) as appropriate.
The Highs and Lows of ATR bands are commonly used to suggest trailing stops for open trades. With Trinity, I have also found that the opposite band can suggest a safe entry level.<
For Long trades, it works like this: After receiving an entry signal - say, Trinity's MACD crosses zero on good volume - we wait for the price to cross (or close) above the Lowest point of the pink band. Note that the Lowest point starts being determined on the signal day, ie on the day that Trinity event happened.
If my entry signal includes a safe entry level (eg FTFF level broken or 4th attempt of breakout successful), there is nothing wrong with following that rule. Otherwise, I'll use the most recent Low of the pink envelope (i.e. the Low that's closest to the entry signal) as my entry level.
Once in the trade, we watch the inner (lime-green) line and pick for our stop level the highest point since entering. We never move the stop down, only higher. As soon as the price falls below the stop level, we sell.
Alternative: "stop on a closing basis", i.e. We wait if the Close is still below the stop level. This may only be suitable for traders who can watch the Market during the day.
As the trade continues and the stop moves into profit territory (i.e. above our entry price) we may use the outer band. As the example shows, such a strategy is more forgiving and tends to keep us longer in the trade. We're letting the profit ride, even though retracements may later erode some of the profit margin.
The program displays the current (green/grey) Highs and (pink/ red) Lows of inner and outer envelopes as lines in the right-hand gap between last day and price axis. This will suffice as long as the entry point is near the left edge of the chart; if the chosen time scale is too long, the Highs before the trade started can obviously distort the picture. (but check RTT ATR EnvelopesEx)
Note also that the default parameters are suggestions only. For some stocks, I found an initial multiple of 0.8 will conserve capital; as the stock moves up, it will quickly get into profit, where I may increase the bandwidth to a multiple of 2.4. Other authors use 1.5 and 3 or 2 and 3.
The markers on the right indicate the most profitable trading levels. They also provide feedback as to whether the chosen parameters are a suitable "fit" for a particular stock. Wherever possible, I try and determine (from history) how a stock moves inside a particular envelope. Knowing this - as part of the stock's DNA - helps check the suitability of any actual strategy.
For Short trades, the roles of red and green lines are reversed inasmuch as we start short-selling at the green (or grey) level, watching the price fall till it rises back above pink or red, where we stop out by buying back.
 Back to Catalogue Back to Catalogue
References:
Pivot Points
IncredibleCharts: ATR
IncredibleCharts: Stop loss
D.Guppy
 Back to Catalogue Back to Catalogue
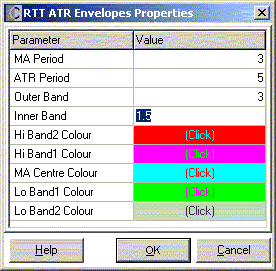
Parameters: MA
Period = period, over which MA is calculated
ATR Period = period, over which ATR is calculated
Outer Band = multiple (ATRs) for outer band
Inner Band = multiple (ATRs) for inner band

Global (File) Parameter Setting for Chart to draw plotted scripts faster:

 Back to Catalogue Back to Catalogue
Example

Back to Catalogue
|


